Beyond data averages: Why country-specific soybean emissions data is the missing link


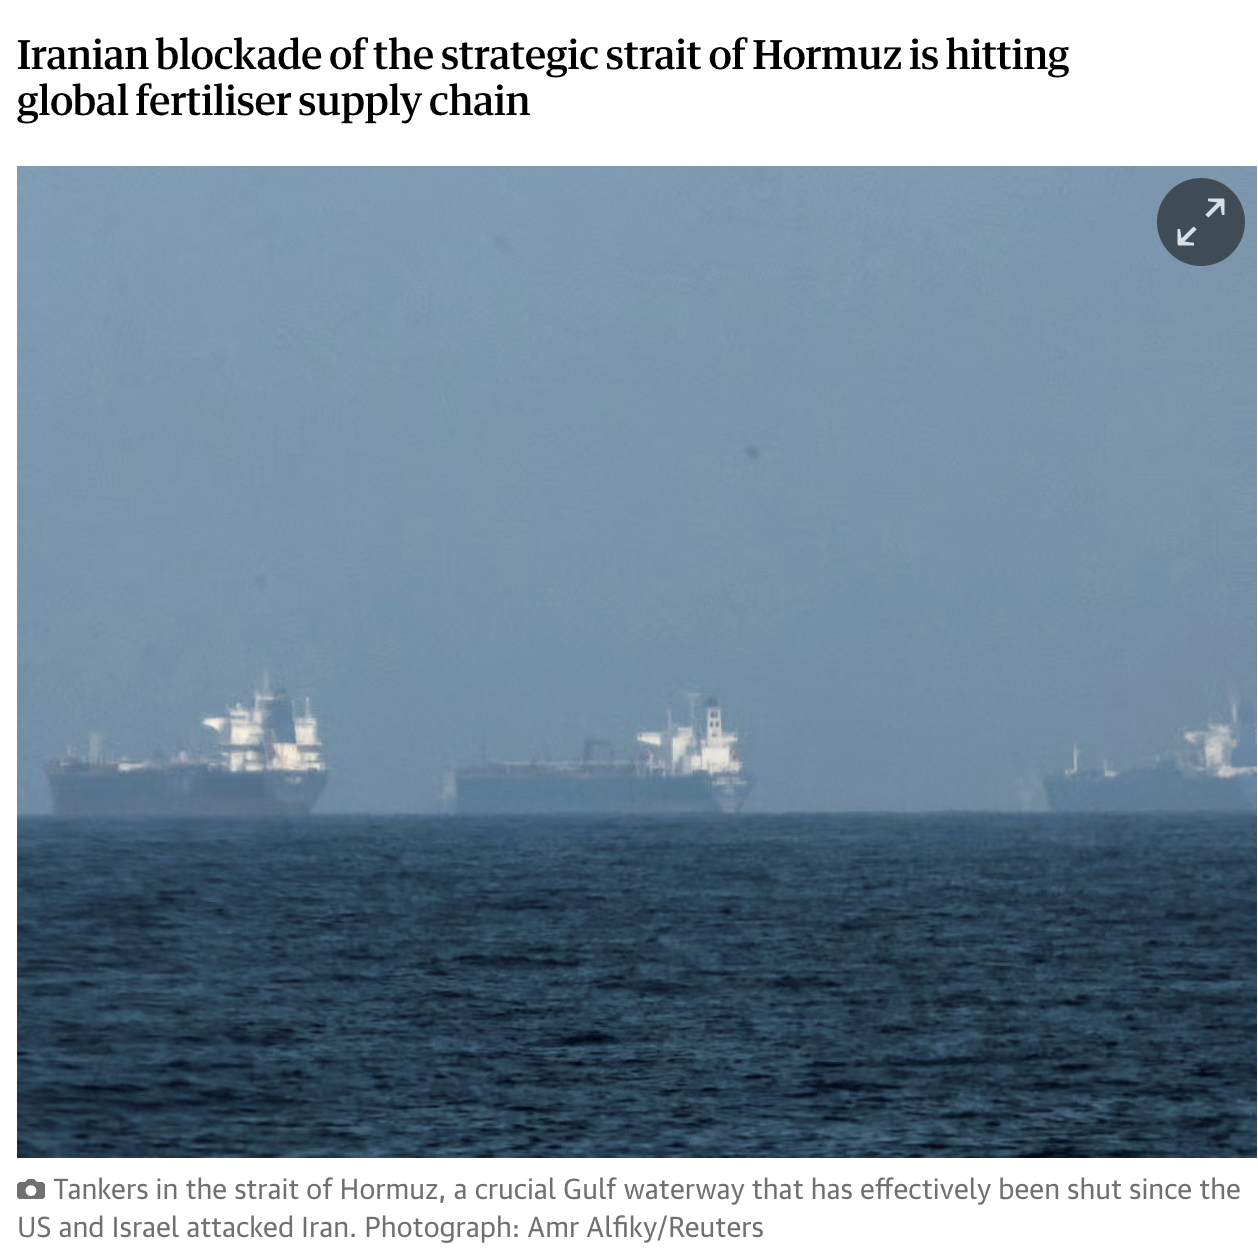
Soybean meal is one of the most widely used ingredients in animal feed. Currently in Europe, the major suppliers of soybean meal include Brazil, Argentina and the United States. Soybean can be a carbon-intensive crop, particularly when sourced from some major soybean-growing countries such as Brazil, where emissions associated with land use change and deforestation are substantial. While replacing soybean meal is difficult due to its importance in animal nutrition, choosing the sourcing country can drastically reduce the climate footprint including deforestation and land-use. For these reasons, European soybean meal is also becoming more attractive due to sustainability and regulatory concerns.

Despite this, it is extremely common for decision-making in sourcing, innovation & operations (and of course the sustainability teams) to be hindered by the limited availability and lack of granularity of emission data. While regional averages (such as a European average) are widely available, country-specific data are only available for a small selection of countries in commercial databases. As a result, when it comes to European soybean meal, many companies still rely on the generic European average value.
In truth, emissions vary significantly by country within Europe. For example, using the European average value instead of the country-specific values for Bulgarian soybean meal would result in underestimating the emissions by 30%, while for Ukrainian soybean meal, it would result in overestimating by 25%. This is especially important because Ukraine is now Europe’s top soybean producer. In 2024, Ukraine harvested over 6.6 million tonnes, more than twice the EU’s total. Ukraine also leads in non-GMO soy exports to the EU and ranks among the world’s top 10 producers. Yet Ukrainian soybean meal is not represented in the major commercial databases.
Without the country-specific emission data, companies risk making sourcing decisions based on flawed data and ruining their climate ambitions, potentially resulting in failure to meet future commitments and regulations.
That’s where Unibloom comes in.
Unibloom’s data expert team has developed refined, country-specific emissions datasets for soybean meal that includes major producers that are missing from general databases. Using a methodology consistent with existing commercial databases and EF3.1, our new datasets fill a critical gap in today’s tools by capturing the granularity of emission data on a country rather than regional level. Our datasets also include the sub-categorisation of total emissions like land use and land use change, FLAG and non-FLAG emissions. Our data is built for immediate integration into the Unibloom platform to formulate the optimal feed strategy.
With our dataset and the Unibloom data & simulation model, companies can:
- Unlock sourcing strategies for better emissions, land-use & deforestation reduction optimised with cost & nutrition, usually hidden by generic averages
- Collaborate with suppliers, sustainability teams and innovation to simulate scenarios for different feed mixes to quantify the impact on cost, nutrition and climate impact
- Sourcing and innovation can better plan ahead and align their strategies and choices with Science Based Targets, climate goals and financials set by sustainability teams, with various options on soybean meal sourcing: evaluate strategies shift to alternative ingredients, location or certification
- Simulate the impact of certifications on cost, emissions & understand the impact on deforestation
- Report emissions more accurately
Has your company signed up for Science-Based Targets? Are you making emission, land-use & deforestation reduction plans for your company to meet customers and investors requirements?
Now is the time for innovation and sourcing teams to take ownership of Science Based Targets initiatives (including FLAG) & climate targets, working closely with sustainability teams to assess options and identify the most effective solutions—balancing financial and climate risks.
The next step is engaging suppliers for real-time collaboration, comparing trials with scalable options for better feed mixes. Spreadsheets, emails, and slide decks won’t cut it. You need a digital simulation tool with integrated data and modelling—fast, cost-effective, and accurate. That’s where Unibloom comes in.
If you’re serious about transparency, de-risking future sourcing & innovation, and reaching your future Science Based commitments, it’s time to use the Unibloom platform and go country-specific. This isn’t just better data. It’s a better way to drive measurable impact, both financial & planetary Generic averages can only take you so far. Our data takes you the rest of the way.
Curious about our data & scenario modelling expertise?
Compare your current datasets with our unique secondary database for agriculture, beef, chicken, pork, chocolate, coffee and more.
Book a free 30-min consultation with our own Dr Johnson Lau or check out case studies from Unilever’s pork division and GoodPop’s ice cream and beverages.
calendly.com/anna-sandgren or anna.sandgren@unibloom.world